Dashboard Design

This Dashboard Design project focused on creating an intuitive, interactive, and visually engaging platform for data visualization and analytics. The goal was to present complex datasets in a clear and actionable manner, helping users make informed decisions quickly. By emphasizing usability and accessibility, the dashboard allows users to monitor KPIs, track trends, and generate reports efficiently.

The design incorporates clean layouts, responsive charts, and real-time data updates, ensuring users can interact with information seamlessly. Iterative design and prototyping were used to optimize user flows, highlight important insights, and ensure the dashboard aligns with both business and user needs.

  • Client: Dashboard Design
  • Location: New York,NY,USA
  • Completed Date: 04-05-2025

Project Requirement

The client required a dashboard that would:

  • icon 
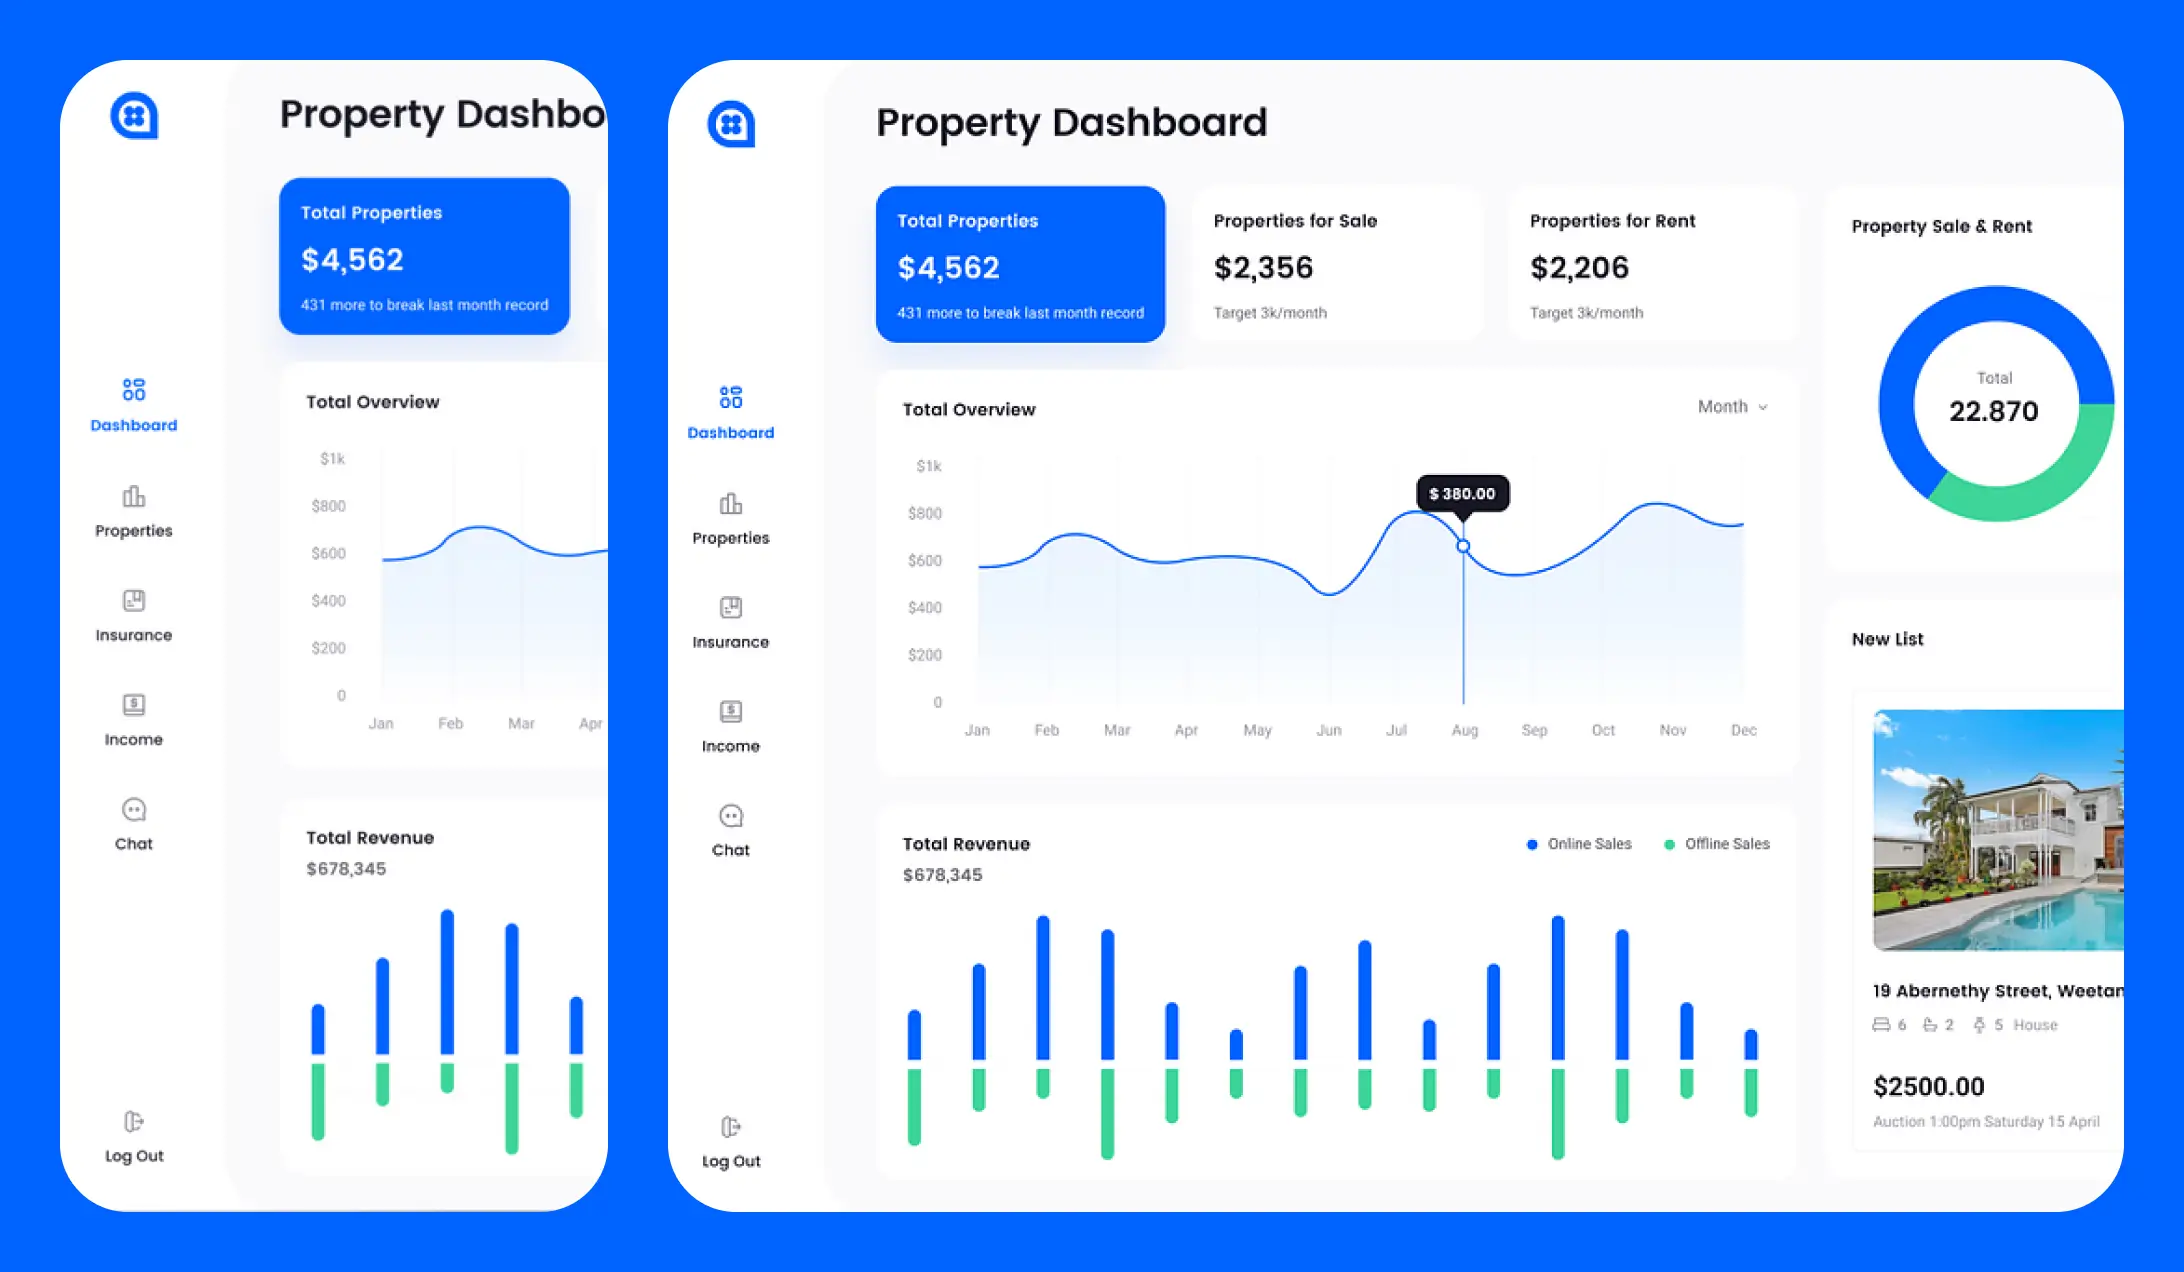
Infrastructure Display key metrics and data in an easy-to-understand format.
  • icon Support interactive charts, graphs, and data filtering.
  • icon Provide real-time updates and alerts for critical information.
  • icon Ensure a responsive design for desktop and mobile devices.
  • icon Enable exportable reports and analytics summaries for stakeholders.

Solution & Result

We developed a custom dashboard design solution featuring interactive visualizations, real-time data integration, and a responsive interface. Users can filter, sort, and explore data efficiently, while stakeholders can generate reports and insights with ease.

  • icon Enhanced Data Visualization
  • icon Improved Decision-Making
  • icon Real-Time Insights
  • icon User-Friendly Interface
  • icon Operational Efficiency

Our Similar Projects